Last reviewed
B2B buyers are making purchasing decisions well before they speak with sales. The challenge for marketers is reaching those buyers early enough and determining which interactions actually produce qualified opportunities.
Recent B2B lead generation statistics show that 67% of surveyed business buyers prefer a sales-representative-free experience, while 77% of purchases in another study went to the vendor buyers had identified as their favorite before contacting sales. Meanwhile, measured advertising data shows substantial differences in cost per lead across channels. These findings suggest that lead generation performance depends on reaching the right buying groups and connecting initial engagement to later sales outcomes.
The following research brings together original studies published in 2025 and 2026, covering buyer behavior, channel adoption, advertising economics, qualification, contact data and artificial intelligence. Each statistic is tied to its original publisher, research period and available sample information.
Key B2B Lead Generation Statistics
The table below summarizes 12 findings from recent primary research. Results represent different populations and measurement methods, so they should not be interpreted as one combined industry dataset.
| Statistic | Finding | Original source and sample |
|---|---|---|
| 67% | B2B buyers prefer an experience without a sales representative. | Gartner, March 2026. Survey of 646 buyers, August–September 2025. |
| 94% | Buying groups ranked their preferred vendors before first sales contact. | 6sense, November 2025. Main survey of nearly 4,000 buyers. |
| 77% | Purchases went to the vendor buyers initially favored before contacting sales. | 6sense, November 2025. Same global buyer study. |
| 85.59% | Surveyed B2B marketers used email for lead generation. | Dux-Soup, February 2026. Survey of 244 marketers at a London event. |
| 36% | Respondents identified content syndication or partner networks among their top lead sources. | Sagefrog, 2026 report released in 2025. Nearly 500 B2B marketing respondents. |
| 7.2 million | First-party gated-content registrations recorded during 2025. | NetLine, April 2026. Platform registration data, not unique buyers. |
| $202 | Reported LinkedIn advertising cost per lead. | Metadata, 2026 report covering 2025. LinkedIn data from 138 B2B advertisers. |
| $524 | Reported Google Ads cost per lead. | Metadata, same report. Google Ads data from 56 advertisers. |
| 30% | Respondents defined MQLs as leads expressing high-intent interest. | Norwest and Marketbridge, November 2025. Survey of 177 B2B sales and marketing leaders. |
| 37% | CRM respondents reported revenue loss attributable to poor data quality. | Validity, July 2025. Survey of 602 CRM users and stakeholders. |
| 12.25% | U.S. sales leaders changed roles over a 12-month period. | Lusha, September 2026. Measured cohort of 140,284 contacts. |
| 95% | B2B marketers reported that their organizations use AI-powered applications. | Content Marketing Institute, October 2025. Survey of 1,015 B2B marketers. |
These figures measure different things. Channel adoption describes what marketers use, cost per lead describes acquisition expense, and lead qualification measures progression toward a sales outcome. None of these metrics independently establishes revenue performance.
How B2B Buyers Research and Choose Vendors
B2B buyers frequently develop preferences before initiating a conversation with sales. That changes when marketing must influence a purchase decision.
In Gartner’s March 2026 research, 67% of 646 surveyed buyers preferred a representative-free purchasing experience. Another 45% reported using AI during a recent purchase.
The preference for independent research does not necessarily mean buyers will complete complex transactions without sellers. Buyers may still require direct conversations to validate technical requirements, resolve commercial questions or confirm implementation details.
The distinction is more apparent in 6sense’s November 2025 Buyer Experience Report.
Among respondents in its global buying research:
- 94% of buying groups ranked preferred vendors before making initial sales contact.
- The preliminary favorite ultimately won 77% of purchases.
- Average reported buying cycles shortened from approximately 11 months in 2024 to 10 months in 2025.
The report’s main research included nearly 4,000 respondents, supplemented by an additional survey of 766 buyers examining AI and economic uncertainty.
The finding that matters most for lead generation is the timing of vendor preference. If buyers tend to identify favorites before direct engagement, measuring only demo requests and contact submissions misses earlier opportunities to influence their decisions.
This supports investment in information that helps buyers evaluate vendors independently: technical documentation, implementation requirements, detailed service information and evidence supporting a company’s claims.
It also provides context for a broader set of B2B lead generation strategies that connect early audience engagement with qualification and pipeline development.
B2B Lead Generation Channel Statistics
Channel performance cannot be reduced to a single ranking. Research on marketer adoption, reported lead quality and observed advertising results produces different answers because each measures a different outcome.
Email Marketing
Email remains widely used in business lead generation.
Dux-Soup’s 2026 B2B Lead Generation Report, based on 244 marketers surveyed at B2B Marketing Live in London, found that 85.59% used email and 85.17% used social media for lead generation.
These adoption figures show how common the channels were within the survey population. They do not establish which produced the most qualified opportunities or the highest return.
Email performance also depends on the relationship between the sender and recipient. A subscriber responding to a requested product update represents a different audience from a newly acquired business contact receiving initial outreach.
For comparative reporting, separate acquisition email from lead nurturing. Measure attributable responses and subsequent qualification within each group rather than combining every email-driven interaction.
Content Syndication
Content syndication can expand access to audiences that a company’s own website or subscriber list does not reach.
In Sagefrog’s 2026 B2B Marketing Mix Report, 36% of respondents identified content syndication or partner networks among their leading sales and marketing lead sources. This tied with directories, sponsorships and industry listings for the highest reported share.
The report gathered insights from nearly 500 B2B marketers across several industries. Its results reflect the respondents’ reported lead sources, rather than independently measured opportunity conversion rates.
NetLine provides a different perspective through observed content engagement.
Its 2026 State of B2B Content Consumption and Demand Report recorded 7.2 million first-party gated-content registrations during 2025. NetLine also reported an average content-consumption gap of 47.7 hours, describing the time between registration and consumption within its network.
Registrations demonstrate participation in a content program, but they do not establish immediate purchase intent. A professional requesting educational material may be researching a future initiative, comparing competing solutions or learning about a category without an active project.
For that reason, content syndication should be evaluated using accepted records, evidence of the original engagement and downstream progression. A lower price per delivered contact is less meaningful if the records fail the company’s qualification requirements.
Companies comparing program models should verify the deliverables, targeting criteria and billable events behind a proposed content syndication service.
Webinars and Events
Events provide opportunities for direct engagement with potential buyers, although attendance does not necessarily indicate sales readiness.
Dux-Soup’s 2026 survey reported that 59.32% of its 244 B2B marketing respondents used events or trade shows for lead generation, compared with 38.98% using webinars.
The results support continued relevance for both formats. However, utilization is not a measure of effectiveness.
A webinar attendee who asks a detailed implementation question provides a different qualification signal from someone who registers but never attends. Likewise, a trade-show contact requesting a proposal represents a different outcome from a badge scan.
Reporting should separate registrants, attendees, meaningful interactions and sales-qualified follow-up. The strongest event metric is the proportion of appropriate contacts who progress into a defined commercial conversation.
Paid Search
Paid search reaches buyers who express an interest through search activity, but acquisition costs vary substantially by market, offer and qualification requirement.
Metadata’s 2026 B2B advertising benchmarks analyzed 2025 advertising activity from 153 B2B advertisers, representing $57.6 million in spend and approximately 211,000 leads.
Within the published Google Ads segment, involving 56 advertisers, the reported cost per lead was $524 and the click-to-lead conversion rate was 1.9%.
These are platform-customer benchmarks, not representative averages of every B2B Google Ads advertiser. They also describe advertising leads rather than independently confirmed opportunities.
A campaign with an expensive submitted lead may still produce acceptable customer economics if that lead is likely to become a customer. Conversely, inexpensive inquiries can consume sales resources without producing revenue.
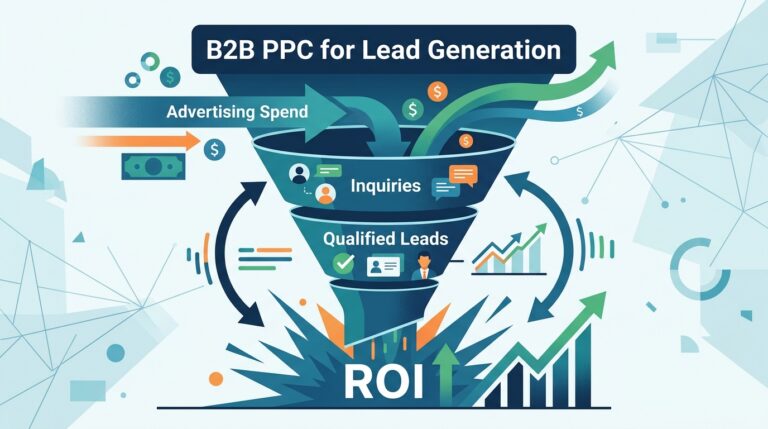
The relevant decision is covered in greater detail in Reach Marketing’s guide to B2B PPC for lead generation.
LinkedIn Advertising
LinkedIn advertising offers professional and company-level targeting, making it particularly relevant to campaigns defined by business role or account characteristics.
In the same Metadata benchmark dataset, 138 advertisers contributed to a reported LinkedIn cost per lead of $202, with a 5.9% click-to-lead conversion rate.
The reported LinkedIn CPL was below the Google Ads figure in this particular dataset. That does not prove LinkedIn is generally less expensive or more effective for B2B acquisition.
Search campaigns capture expressed demand, while LinkedIn campaigns can target relevant professionals who are not actively searching for a solution. Their acquisition conditions and lead definitions may differ.
Comparisons become more useful when both channels are evaluated using the same qualification rules and downstream outcomes.
B2B Cost Per Lead and Conversion Rate Benchmarks
Cost per lead (CPL) measures acquisition spending divided by the number of leads generated.
The calculation is straightforward:
Cost per lead = campaign acquisition cost ÷ leads generated
Its usefulness depends on what the organization counts as a lead and which costs are included.
In Metadata’s 2025 campaign dataset, the reported channel CPL figures were $202 for LinkedIn and $524 for Google Ads. Those figures should not be treated as universal budget targets. Differences in customer profile, industry, targeting and offer can produce substantially different outcomes.
A more informative comparison connects cost to qualification.
Consider the following illustrative calculation, which is not an industry benchmark.
A company spends $10,000 and generates 100 submitted leads. Twenty meet its agreed qualification standard.
Its cost per submitted lead is $100, while its cost per qualified lead is $500.
If another campaign generates fewer submissions but more qualified opportunities at the same spend, it may represent the stronger investment despite having a higher initial CPL.
The comparison also depends on consistent stage definitions. A contact registered for a guide should not be counted as equivalent to a prospect whose business need has been confirmed by sales.
For established programs, acquisition reporting should connect lead source, acquisition cost, sales acceptance, qualified opportunity creation and eventual revenue.
Lead Quality and MQL-to-SQL Conversion
Marketing qualified leads (MQLs) and sales qualified leads (SQLs) represent different stages of a company’s qualification process.
An MQL has met the marketing team’s agreed criteria for further engagement. An SQL has met the relevant sales qualification criteria, usually following a review of business fit and purchasing circumstances.
There is no single MQL-to-SQL conversion rate that applies consistently to every B2B company.
One reason is that organizations use different definitions.
The 2025 Norwest and Marketbridge B2B Sales & Marketing Benchmark Report, based on 177 B2B sales and marketing leaders, found that 30% defined MQLs as leads expressing high-intent interest. Another 25% used a demographic-fit and engagement scoring model, while 22% required engagement combined with a match to the target persona.
These approaches can identify substantially different populations even when the same label is used.
For a measured conversion reference, Optifai’s April 2026 sales operations benchmark reports a 40% MQL-to-SQL figure within its B2B SaaS funnel model, using an analysis described as covering anonymized CRM data from 939 B2B companies between Q2 2025 and Q1 2026. The underlying dataset spans several industries and company sizes, so the figure should be treated as a vendor-specific reference rather than a universal SaaS standard.
The correct calculation for a company’s own process is:
MQL-to-SQL conversion rate = MQLs that become SQLs ÷ eligible MQLs in the same cohort × 100
Cohort timing matters. Newly acquired MQLs should receive enough time to progress before being compared with older cohorts.
Lead quality is also easier to assess when sales records the reason for accepting or rejecting a lead. Useful distinctions include unsuitable account, insufficient buying intent, invalid contact information and lack of a relevant business need.
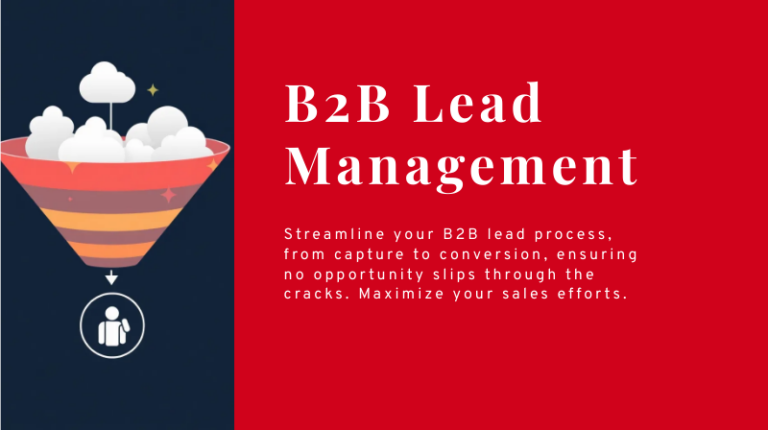
These definitions should be aligned with the company’s existing marketing qualified lead criteria rather than accepting stage labels supplied by an advertising or lead-generation vendor.
B2B Data Quality and Contact Data Decay
Contact databases lose accuracy as professionals change roles, move employers and update their contact details.
However, commonly repeated annual data-decay percentages often combine different problems without identifying how they were measured.
A more specific measurement comes from Lusha’s September 2026 contact decay research.
The company measured 140,284 U.S. sales leaders at vice president and C-suite levels and found that 12.25% changed roles over a 12-month period. Across 24 months, the measured role-change figure was 25.67%.
These results concern employment and role changes within a defined cohort. They do not measure the total proportion of business email addresses that become undeliverable or every possible source of CRM inaccuracy.
The financial consequences of poor CRM data appear in separate survey research.
Validity’s 2025 State of CRM Data Management report, based on 602 users and stakeholders, found that 37% reported losing revenue because of poor data quality. In the same survey, 76% said less than half of their organization’s CRM data was accurate and complete.
These are respondent-reported assessments rather than independently audited revenue losses.
For lead generation teams, inaccurate data affects more than email delivery. A record can contain a working email address while identifying the wrong job function or employer, producing misleading qualification and account assignments.
Data-quality programs should distinguish contact validity from account fit and purchasing authority. Regular verification, duplicate management and documented source information make downstream reporting more reliable.
The frequency of verification should reflect how the data is used. A database supporting active outbound campaigns may require more frequent checks than a historical reporting dataset.
AI Adoption in B2B Lead Generation
AI use among B2B marketing teams is widespread, but adoption statistics should not be confused with evidence of improved lead conversion.
The Content Marketing Institute and MarketingProfs’ research for 2026, published October 8, 2025, surveyed 1,015 B2B marketers.
The research found that 95% reported using AI-powered applications within their organizations. Among those using AI, 89% used content creation or optimization tools.
The adoption figures show how extensively AI has entered marketing workflows. They do not establish a measurable percentage improvement in lead scoring accuracy, opportunity conversion or acquisition costs.
The same research found that 91% of surveyed B2B marketers collected first-party data, although a substantial share described their data strategy as being in an early development stage.
AI systems used for lead prioritization depend on the quality and relevance of the underlying information. A model trained on weak qualification labels may reproduce the same problems at greater scale.
Three distinctions are especially useful when evaluating AI-related claims:
- Adoption: Whether teams have implemented AI-powered tools.
- Operational outcomes: Whether measured tasks require less work or take less time.
- Commercial outcomes: Whether comparable leads are more likely to become qualified opportunities or customers.
An efficiency improvement in preparing content or enriching CRM records cannot automatically be translated into increased sales conversion.
To establish a commercial benefit, teams should compare outcomes using documented definitions, appropriate evaluation windows and equivalent lead populations.
Research Methodology and Limitations
The statistics in this article were selected from original research published or updated during 2025 and 2026. Sources include buyer surveys, marketer surveys, anonymized CRM research, advertising platform data and observed content registrations.
Several limitations affect interpretation.
Survey results reflect respondents’ experiences. Adoption percentages describe the surveyed population, which may differ from the wider B2B market. Event-based surveys may overrepresent professionals who actively use particular marketing channels.
Platform results reflect the publisher’s customer base. Advertising and content engagement datasets can provide useful observed outcomes, but they do not necessarily represent companies using other platforms or service models.
Metric definitions differ across studies. A content registration, advertising form submission, marketing qualified lead and sales opportunity are different outcomes. Their costs and conversion rates should not be compared without accounting for those differences.
Vendor-sponsored studies require context. The research is attributed to its original publisher and described according to the population it measured. Publication by a commercial company does not automatically invalidate the findings, but the data should not be treated as independent evidence of that company’s product effectiveness.
No proprietary Reach Marketing performance benchmarks are included because independently documented and publication-approved program data was not supplied.
The changing role of AI in buyer research, evolving advertising costs and the reliability of contact information make quarterly reviews useful. Future editions should retain the original study dates and replace figures only when newer research provides a comparable measurement.