In 2025, open rates are no longer a trustworthy measure of email campaign success. As privacy features distort tracking data and email client behaviors evolve, marketers must dig deeper to evaluate what truly drives engagement and revenue. This guide explores essential B2B email marketing metrics—from click-through rates and conversion rates to list quality, revenue attribution, and deliverability—to help you measure campaign performance more effectively and refine your strategy for growth.
Why Open Rates Are No Longer the Gold Standard
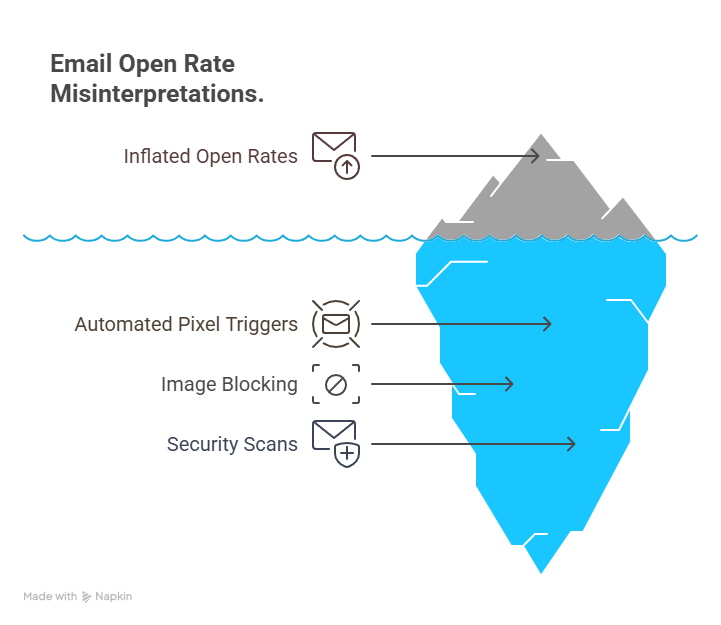
Email remains a go-to tool for B2B marketing, but relying on open rates as a key performance indicator is becoming a mistake. With Apple’s Mail Privacy Protection, Gmail’s image proxying, and other anti-tracking systems in play, open rates often tell a misleading story.
A few reasons open rates are unreliable today:
- Privacy Software Inflates Opens: Platforms like Apple Mail automatically trigger tracking pixels whether or not a user actually reads the message.
- Image Suppression Distorts Data: Some email clients block images (and tracking pixels) by default, suppressing legitimate opens.
- Bots and Security Scans Falsify Results: Email security systems often scan incoming messages, falsely registering them as opened.
These distortions make it harder to understand whether your message is landing with the right audience—or being ignored altogether. In B2B, where decisions involve multiple stakeholders and long sales cycles, this kind of ambiguity is costly.
Metrics That Truly Reflect Campaign Effectiveness
If you want a clear picture of how your emails are performing, focus on outcomes and behaviors—not just visibility. Here are the key metrics every B2B email marketer should track in 2025:
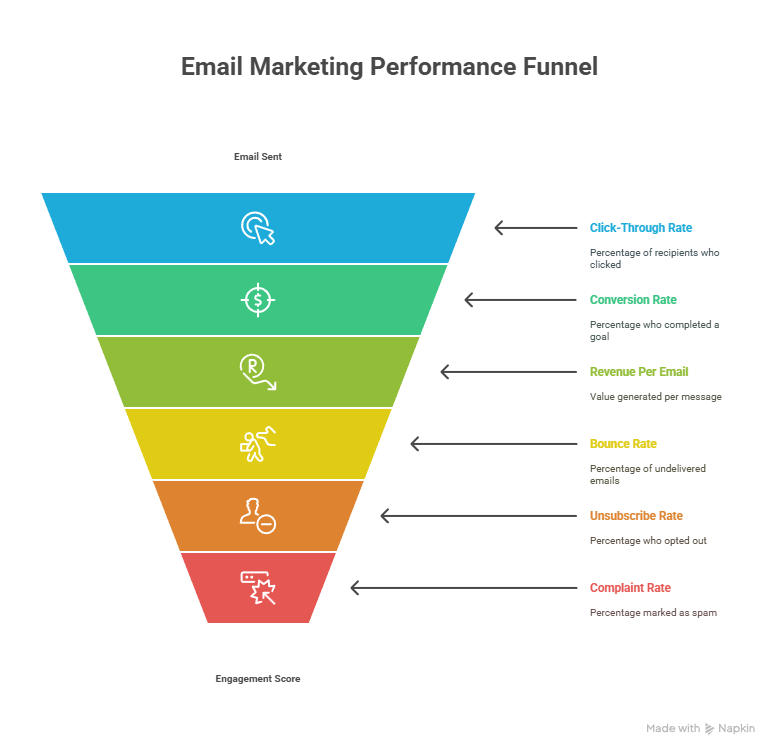
1. Click-Through Rate (CTR)
What it tells you: How many recipients clicked on links in your email.
Why it matters: Clicks represent action. They indicate that your message sparked enough interest to warrant engagement.
How to use it:
- Compare CTR across audience segments and content types.
- A/B test calls-to-action, visuals, and layout.
- Use CTR data to prioritize topics or offers that drive the most interest.
2. Click-to-Open Rate (CTOR)
What it tells you: The percentage of email openers who clicked a link.
Why it matters: CTOR gives insight into the strength of your email content independent of subject line or timing.
How to use it:
- Optimize internal messaging, design, and CTA placement.
- Evaluate different formats (e.g., plain text vs. HTML).
- Understand which segments are most receptive to your offers.
3. Conversion Rate
What it tells you: The percentage of recipients who completed a goal after clicking.
Why it matters: This is your clearest link between email performance and business outcomes—especially for B2B teams working toward pipeline growth.
How to use it:
- Define meaningful goals (e.g., demo request, whitepaper download).
- Tie conversions to sales-qualified leads (SQLs) in your CRM.
- Track both micro- and macro-conversions throughout your nurture journey.
4. Revenue Per Email (RPE)
What it tells you: How much revenue is generated for each email sent.
Why it matters: This ties engagement to business value, showing how much each email contributes financially.
How to use it:
- Use eCommerce or CRM data to connect sales outcomes to email.
- Allocate budget based on RPE performance by list segment.
- Double down on high-performing messages that consistently deliver returns.
5. Engagement Score (Lead Scoring by Email Activity)
What it tells you: A points-based system measuring recipient interactions.
Why it matters: Scores help sales teams identify warm leads and tailor outreach accordingly.
How to use it:
- Assign weighted values to key actions (clicks, form submissions, meeting requests).
- Trigger nurture flows or alerts based on score thresholds.
- Review engagement scores regularly to spot drop-offs or potential reactivation opportunities.
6. List Health and Hygiene
A neglected list leads to poor results across the board. These sub-metrics keep your database clean:
- Bounce Rate: A high bounce rate indicates invalid or outdated emails.
- Unsubscribe Rate: Can point to over-sending or irrelevant messaging.
- Spam Complaints: Damaging to sender reputation—keep these under 0.1%.
- Inactive Subscribers: Monitor who hasn’t engaged in 60–90 days.
How to use it:
- Regularly scrub and update your email list.
- Use re-engagement campaigns for inactive contacts.
- Set engagement thresholds before onboarding third-party lists.
7. List Growth Rate
What it tells you: Net subscriber growth over time, factoring in new sign-ups and unsubscribes.
Why it matters: A healthy, expanding list reflects good audience targeting and top-of-funnel momentum.
How to use it:
- Break growth out by acquisition source.
- Monitor drop-off rates by campaign type.
- Align list growth goals with broader demand generation KPIs.
8. Email Deliverability
What it tells you: The percentage of emails that successfully reach inboxes.
Why it matters: Even a perfectly written message is useless if it lands in spam.
How to improve it:
- Use authenticated sending protocols (SPF, DKIM, DMARC).
- Avoid spammy subject lines and link stuffing.
- Monitor blacklist status and sender score regularly.
From Metrics to Models: Attribution That Tells a Story
Email should be part of a connected funnel, not a siloed channel. Attribution models help illustrate how email contributes to the overall buyer journey.
Attribution Models to Consider:
With proper CRM integration, these models allow you to understand which emails build momentum—and which ones fall flat.
- First-Touch: Did the first email prompt interest or a site visit?
- Last-Touch: Was email the final nudge before a decision?
- Multi-Touch: How did a series of messages influence the outcome?
Building an Email Performance Dashboard That Drives Strategy
Your dashboard should provide clarity, not clutter. Here’s a simplified template:
| Metric | What It Measures | Target |
| Click-Through Rate | % who clicked | >2% |
| Conversion Rate | % who completed a goal | >1.5% |
| Revenue Per Email | Value generated per message | Variable |
| Bounce Rate | % undelivered | <2% |
| Unsubscribe Rate | % who opted out | <0.3% |
| Complaint Rate | % marked as spam | <0.1% |
| Engagement Score | Weighted interaction score | Custom threshold |
| List Growth Rate | Net list expansion | >3% monthly |
| Deliverability Rate | % reaching inboxes | >95% |
Final Takeaways: What B2B Teams Must Prioritize
If you’re still judging email success by opens alone, you’re missing the big picture. These are the key priorities for 2025:
- Retire open rates as a primary KPI
- Track behavior-based metrics like clicks, conversions, and revenue
- Maintain a clean and growing list
- Use attribution to connect emails to pipeline outcomes
- Test consistently and refine messaging based on real data
A Smarter Way to Measure Email Success
Effective B2B email marketing is no longer about superficial numbers. In today’s landscape, success is defined by action—clicks, conversions, pipeline acceleration, and revenue. While open rates may still offer directional insight, they’re no longer the metric to build your strategy around.
Instead, adopt a modern, holistic framework that gives you visibility into what’s working, what’s not, and where to go next. By aligning your metrics with business impact, you’ll turn email into a true growth engine—not just another channel.